Grok just released an incredible chart making tool. This morning, I used it to visualize some fascinating data, including cloud spend, GDP growth and fertility rates.
Everything Is Computer
This morning, I was researching an investment in a cloud infrastructure company. So I wondered, how much do companies spend on cloud compute and what’s the trend?
Let’s ask Grok…

Grok came up with a gorgeous chart showing cloud spend for the last 5 years, just as I asked.
I love the design here — it reminds me of a Bloomberg terminal. You can also mouse over the graphics and see exact numbers, which is super helpful.
As it makes the chart, Grok explains where the data is coming from. I clicked through and checked some of the sources, and Grok was pulling the data accurately.
It turns out cloud spend is growing way faster than I thought. It has more than doubled in the last 5 years, topping $800 billion.
Looks like I need to invest in that company!
American Exceptionalism
Let’s move from today’s business problems to some big picture questions…
In the last few decades, America has begun to pull away from the rest of the developed world. People are calling Europeans the “Europoors,” a term that never existed when I was a kid.
So I wondered, how real is the divergence between America and the rest? Let’s see what Grok has to say…
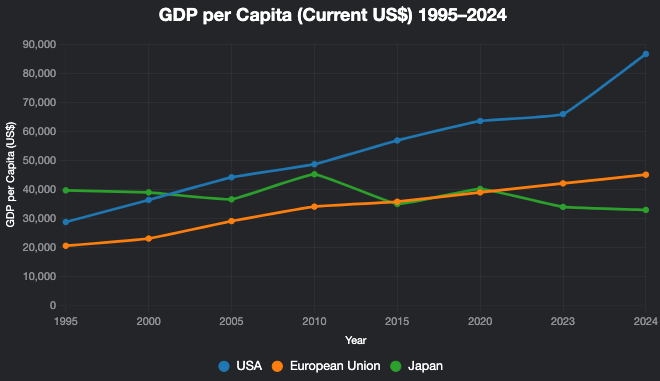
For this chart, Grok produces a lovely line graph.
That’s a much better way to visualize this data than the bar chart we saw before. I didn’t have to tell Grok to do this…it chose the chart method on its own. Impressive!
In 1995, Japan actually ranked higher than the US or what is today the EU. Incredible!
By 2025, the US had pulled far ahead of the pack. America’s GDP per capita sits at nearly $90,000 a year versus Europe at just $45,000. Japan’s GDP per capita has actually fallen in real terms, from $40,000 in 1995 to $33,000 today.
We’ve gone from being around 50% richer than Europe in 1995 to twice as rich today. And we’re almost 3 times richer than Japan, which is staggering given how technologically advanced Japan is.
The Baby Bust
One of the big reasons America is outpacing Europe and Japan economically is our growing population. We have higher fertility than most of Europe. Meanwhile, Japan’s population is in outright decline.
Let’s graph fertility across these regions….
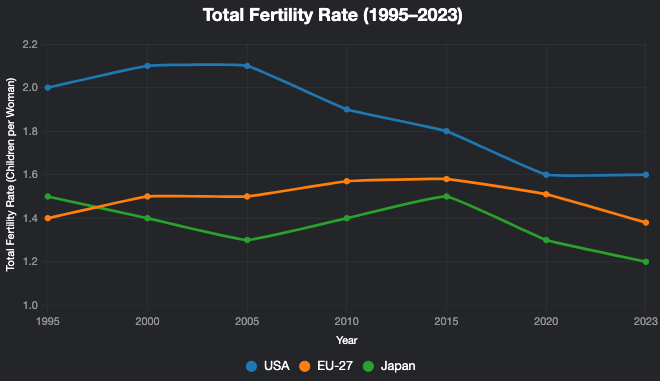
Turns out, fertility is falling everywhere. America is doing better than most developed countries, but we need to pump up those numbers if we’re going to remain a superpower.
I’m looking for early stage startups that can help address the fertility crisis. If you know one, let me know!
Wrap-Up
I loved using Grok’s new charts function. It works beautifully, scraping data from all over the web and putting it in a beautiful format.
I’m going to use this when I research startups. It will help me understand markets better.
I can also produce some cool charts for the blog. You may start seeing more of those soon!
Congrats to the xAI team on a great launch. Give Grok charts a try and make some cool graphics!
More on tech:
Using Grok as My Personal Trainer
Using Grok 3 to Manage My Stock Portfolio
Save Money on Stuff I Use:
This platform lets me diversify my real estate investments so I’m not too exposed to any one market. I’ve invested since 2018 with great returns.
More on Fundrise in this post.
If you decide to invest in Fundrise, you can use this link to get $100 in free bonus shares!
I’ve used Misfits for years, and it never disappoints! Every fruit and vegetable is organic, super fresh, and packed with flavor!
I wrote a detailed review of Misfits here.
Use this link to sign up and you’ll save $15 on your first order.

Leave a comment